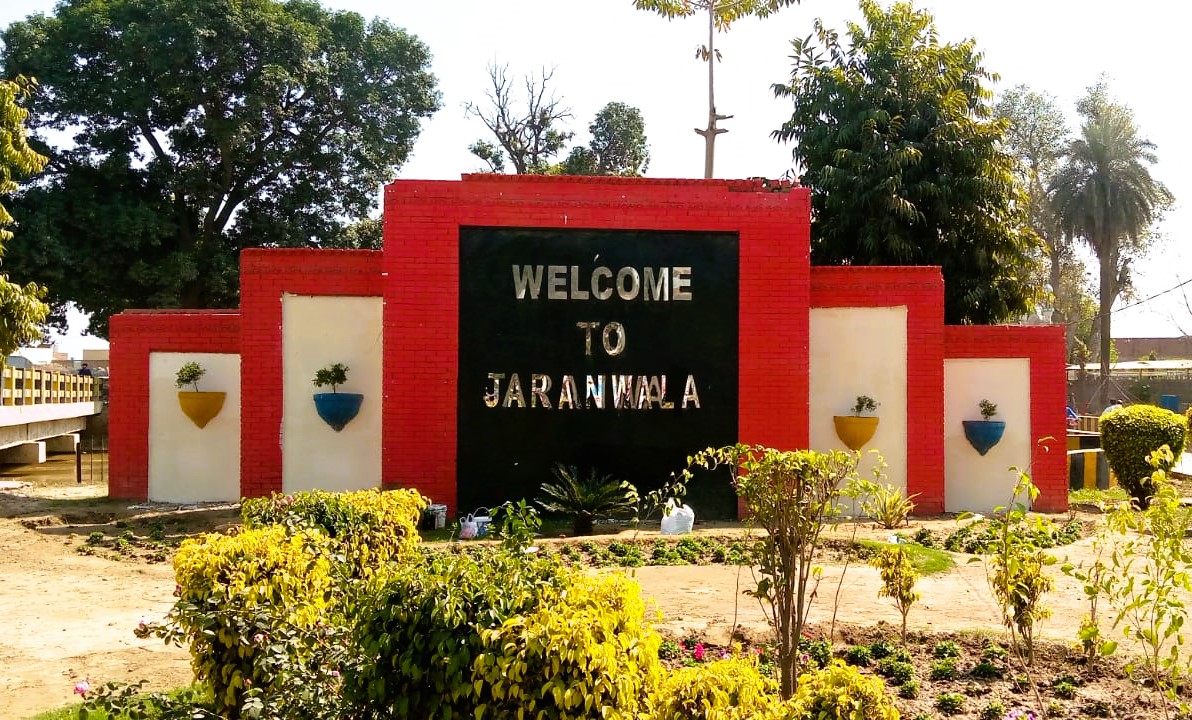
People of Jaranwala will have access to clean drinking water for all day long along with the provision of other facilities at their doorstep.

Municipal Committee Jaranwala facilitate its citizen towards sustainable economic growth, infrastructure development, social development and municipal services excellence. MC Jaranwala promises to provide the basic amenities to general public with full dedication, commitment and exuberance and always striving hard to create business conducive environment, Citizen Centric (Baldia to Citizen) environment and implementation of E-Governance initiatives. MC Jaranwala plans to establish orderly development, well maintained infrastructure and efficient delivery of social services to its people.

An efficient, well-structured and modernized Local Government system that empowers and enhances the quality of life of its citizens through service excellence and improved municipal service delivery. To develop Jaranwala City toward engine of growth, center of economic activities, industrial promotion and employment generation.
Municipal Committee Jaranwala is focusing on:
• Spreading congenial environment for its citizen by providing improved municipal service delivery mechanism
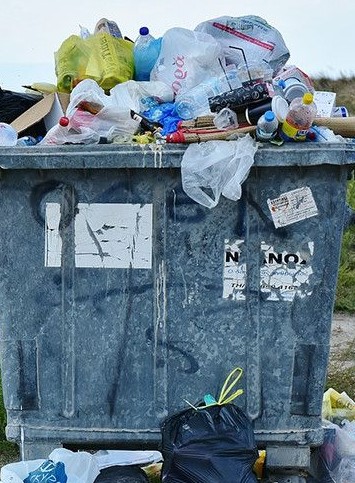
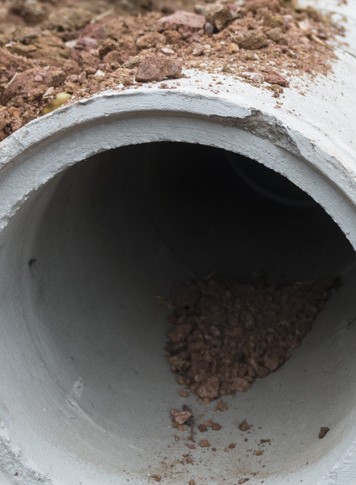
• Implementation of public health initiatives includes water supply, sewerage & sanitation, eradication of communicable diseases, infrastructure development
• Providing public facilities such as education, awareness, recreation, regulatory functions related to prescribing and enforcing building regulations, encroachments
• Looking after existing repair and maintenance of infrastructure
• Planning of infrastructure needs in recognition of urbanization and wide spread of population in the Municipal proximity
• Implementation of E-Governance initiatives in line with Local Government & Community Development Department, Government of Punjab decisions
• Implementation of efficient registration and redressal of citizens’ complaint mechanism system .